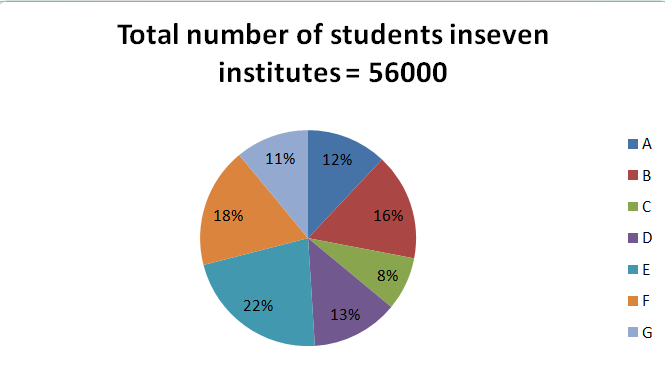
In a series of providing data Interpretation practice questions, today I am providing two sets.
Study the following pie chart and table carefully to answer the given questions.
|
Institute
|
M : F
|
|
A
|
7 : 9
|
|
B
|
5 : 3
|
|
C
|
6 : 2
|
|
D
|
6 : 8
|
|
E
|
3 : 4
|
|
F
|
8 : 12
|
|
G
|
12 : 4
|
1) What is the ratio of the number of
female students in Institute F to that of male students in Institute C?
a) 1 : 6 b)
2 : 3 c) 1 : 4
d) 6 : 1 e)
None of these
2) The total number of students studying in
Institute F is what percent of the total number of students studying in
Institute C?
a) 125% b)
175% c) 225%
d) 150% e)
None of these
3) Which institute has the maximum number
of students and which has the minimum number of students respectively?
a) E and G b) F
and C c) B and E
d) A and E e) E
and C
4) The number of female students from Institute
E is what percent of the total number of students from all the institutes?
(Calculate the approximate value)
a) 9% b)
8% c) 7%
d) 10% e)
13%
5) What is the difference between the total
number of students from all the institutes and the number of male students from
Institute A, D and G?
a) 46000 b)
46520 c) 46550
d) 45320 e)
46250
Study the given line graph carefully and answer the following questions.
The graph shows the ratio of imports to exports of two companies A and B over
the years.
6) If the total import of Company A in the year
2010 was Rs.54.6 Lakh, then what was its export (in lakh) in that year?
a) 22.84 b)
21.84 c) 23.630
d) 23.86 e)
None of these
7) The ratio of imports to exports of
Company A in the year 2012 was what percent more than that of Company B in the
year 2008?
a) 45% b)
40% c) 50%
d) 60% e)
30%
8)If the imports of Company A in the year
2012 increased by 40% and the exports decreased by 20%, then what would be the
new ratio of imports to exports of Company A in that year?
a) 5 : 21 b) 9
: 5 c) 14 : 5
d) 5 : 9 e)
21 : 5
9)If the imports of Company A in the year
2010 and the exports of Company B in the year 2010 were Rs.42 Lakh and rs.70
Lakh respectively, then the imports of Company B in the year 2010 would be what
percent of the exports of Company A in the year 2014?
a) 350% b)
200% c) 300%
d) 400% e)
250%
10) In which year is the difference between
import and export of Company A the minimum?
a) 2009 b)
2012 c)
2013
d) 2014 e)
None of these
11) For Company A, the export is greater
than import for how many years from 2008 to 2014?
a) 4 b)
3 c) 2
d) 5 e)
Cannot be determined
Answers:
1. E2. C
3. E
4. E
5. D
6. B
7. C
8. E
9. E
10. C
11. B


