In a series of providing practice questions for Data Interpretation section, today I am providing double diagram practice questions set.
Set 1
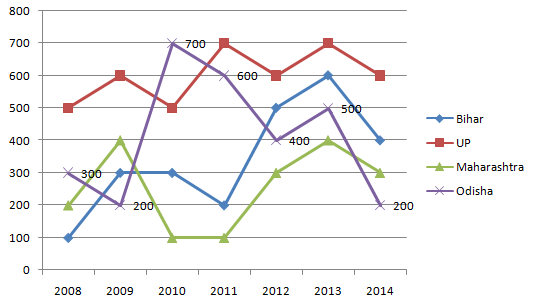
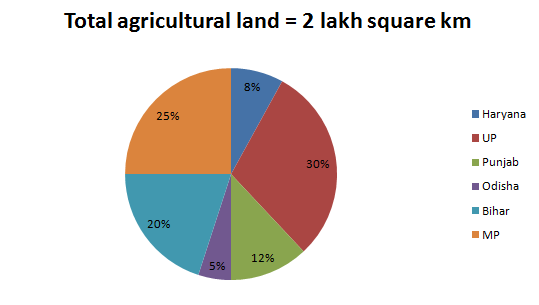
Study the pie-chart and line graph carefully to answer the given
questions
The pie-chart
shows the percentage of train accidents in different years
The line graph shows the number
of persons who died in train accidents in various states in different years
1) The
number of persons who died in train accidents in 2013 is how much percent more
than the number of persons who died in the train accident in 2011?
a)
143.5% b) 137.5% c) 37.5%
d)
127.5% e) 147.5%
2) What
is the average of the number of persons who died in train accidents in 2008 in
all states together?
a)
182 b) 290 c) 275
d)
284 e) 307
3) In
which state is the number of persons who died in the train accidents the
maximum during the given period?
a)
Odisha b) UP c) Bihar
d)
Only a) and b) e) Maharashtra
4) What
is the difference between the number of train accidents in 2014 and that in
2012?
a)
5 b) 6 c) 7
d)
8 e) 9
5) What
is the ratio of the number of persons who died in train accidents in 2010 to
that in 2014?
a)
8 : 7 b) 10 : 9 c) 12 : 11
d)
14 : 13 e) 16 : 15
Set 2
Study the given bar graph and pie chart to answer the following
questions.
The bar graph
shows the production (in thousand tones) of Wheat, Rice and Maize in different
states.
The pie-chart shows the
percentage of agricultural land in the given six states.
Productivity
= Total production / Area of agricultural land
6) The
productivity of which state is the maximum?
a)
Bihar b)
Haryana c)
Punjab
d)
UP e) MP
7) The
production of which state is the maximum?
a)
Bihar b)
MP c)
Haryana
d)
UP e) Punjab
8) The
production of wheat in Punjab is what percent more than the production of Maize
in Odisha?
a)
350% b) 250% c) 300%
d)
200% e) 400%
9) What
is the ratio of the production of Rice in Bihar to the production of Wheat in
Haryana?
a)
2 : 3 b) 3 : 2 c) 2 : 1
d)
1 : 1 e) 1 : 2
10) If MP
exports 40% of Rice at the rate of Rs.30 per kg and UP exports 30% of Rice at
the rate of Rs.32 per kg, then what is the ratio of the incomes from the
exports?
a)
65 : 48 b) 31 : 42 c) 43 : 54
d) 57 : 62 e) 1 : 2
1.
Option C
The number of people who died in train
accidents in 2013 = 400 + 500 + 600 + 700 = 2200
The number of people who died in train
accidents in 2011 = 100 + 200 + 600 + 700 = 1600
So, required % =
2200 – 1600 x 100 / 1600 = 37.5%
2.
Option C
Average number of people who died in
train accidents in all states in 2008 = 1/4 × (100 + 200 + 300 + 500)
= 1100/4 = 275
3.
Option B
The number of deaths in train
accidents in Bihar = 100 + 300 + 300 + 200 + 500 + 600 + 400 = 2400
Similarly, in UP
= 500 + 600 + 500 + 700 + 600 + 700 + 600 = 4200
In Maharashtra =
200 + 400 + 100 + 100 + 300 + 400 + 300 = 1800
In Odisha = 300
+ 200 + 700 + 600 + 400 + 500 + 200 = 2900
In UP the number
of people who died in train accidents is the maximum.
Quicker method it is clear from the
graph that the highest number of people died in UP.
4.
Option D
The number of train accidents in 2014
= 200 × 18/100 = 36
The number of
train accidents in 2012 = 200 × 14/100 = 28
So, required
difference = 36 ⎯ 28 = 8
5.
Option E
The ratio of the number of deaths in
2010 to that in 2014 = (100 + 300 + 500 + 700) : (200 + 300 + 400 + 600) = 1600
: 1500 = 16 : 15
6.
Option B
Productivity = Total Production / Area
of agricultural land
Productivity of UP = (35 + 30 + 25) x
1000 /
2 Lakh x 30/100 = 90000 / 60000 = 1.5 tonnes per sq km
Productivity of MP = (30 + 32.5 +
27.5) x 1000 / 2 Lakh x 25/100 = 90000 / 50000 = 1.8 tonne per sq km
Productivity of Bihar = (22.5 + 25 +
27.5) x 1000 / 2 Lakh x 20/100 = 75000 / 40000 = 1.875 tonnes per sq km
Productivity of Odisha = (22.5 + 15 +
10) x 1000 / 2 Lakh x 5/100 = 47.5 x 1000 / 10000 = 4.75 tonnes per sq km
Productivity of Haryana = (25 + 35 +
30) x 1000 / 2 Lakh x 8/100 = 90000 / 16000 = 5.625 tonnes per sq km
Productivity of Punjab = (40 + 30 +
35) x 1000 / 2 Lakh x 12/100 = 105000 / 24000 = 4.375 tonnes per 
So, productivity
of Haryana is the maximum
7.
Option E
Production of Punjab is maximum =
105000 tonnes
8.
Option C
Production of Wheat in Punjab = 40000
tonnes
Production
of Maize in Odisha = 10000 tonnes
So, required % =
40000 – 10000 / 10000 × 100% = 300%
9.
Option D
The ratio of production of Rice in
Bihar to the production of Wheat in Haryana = 25000 tonnes : 25000 tonnes = 1 :
1
10. Option
A
Income of MP from export of 40% of Rice at
the rate of Rs.30 per kg = 32500 × 40/100 × 1000 × 30 = Rs.39 Crore
Income of UP
from export of 30% of Rice at the rate of Rs.32 per kg = 30000 × 1000 × 30/100
× 32 = Rs.28.8 Crore
So, required
ratio = 39 : 28.8 = 390 : 288 = 65 : 48


